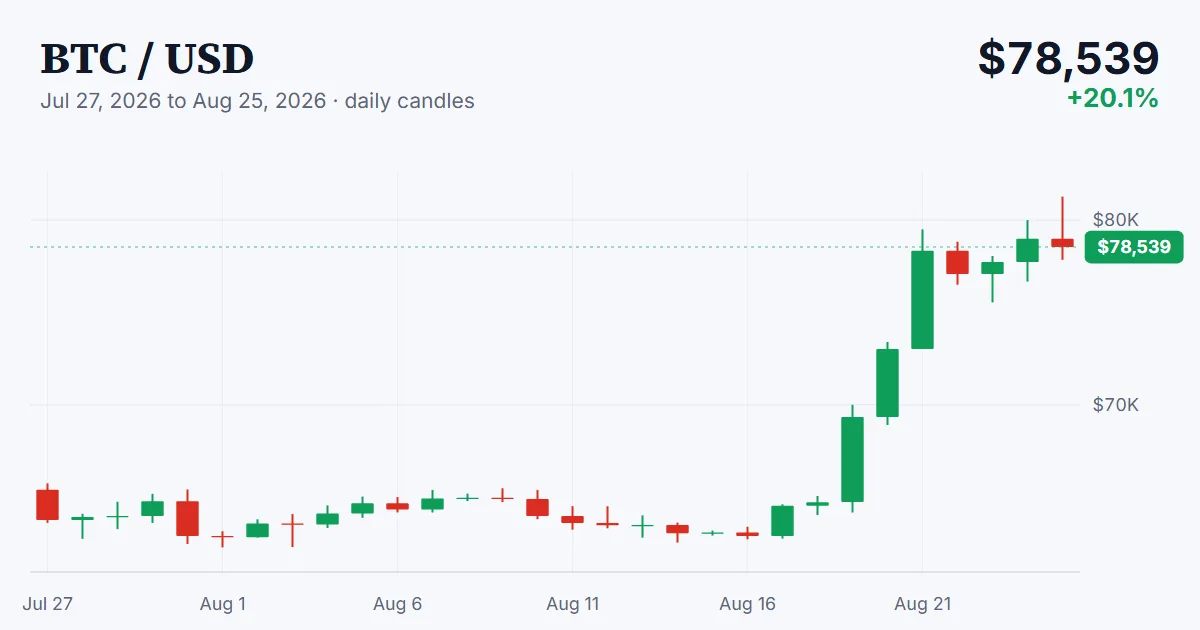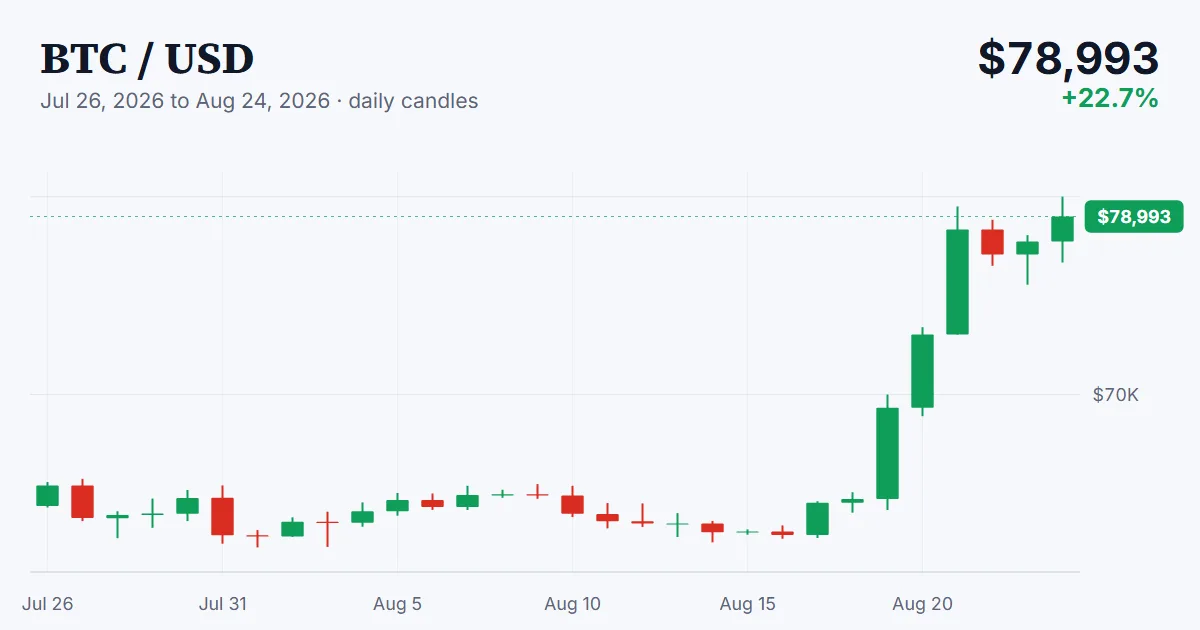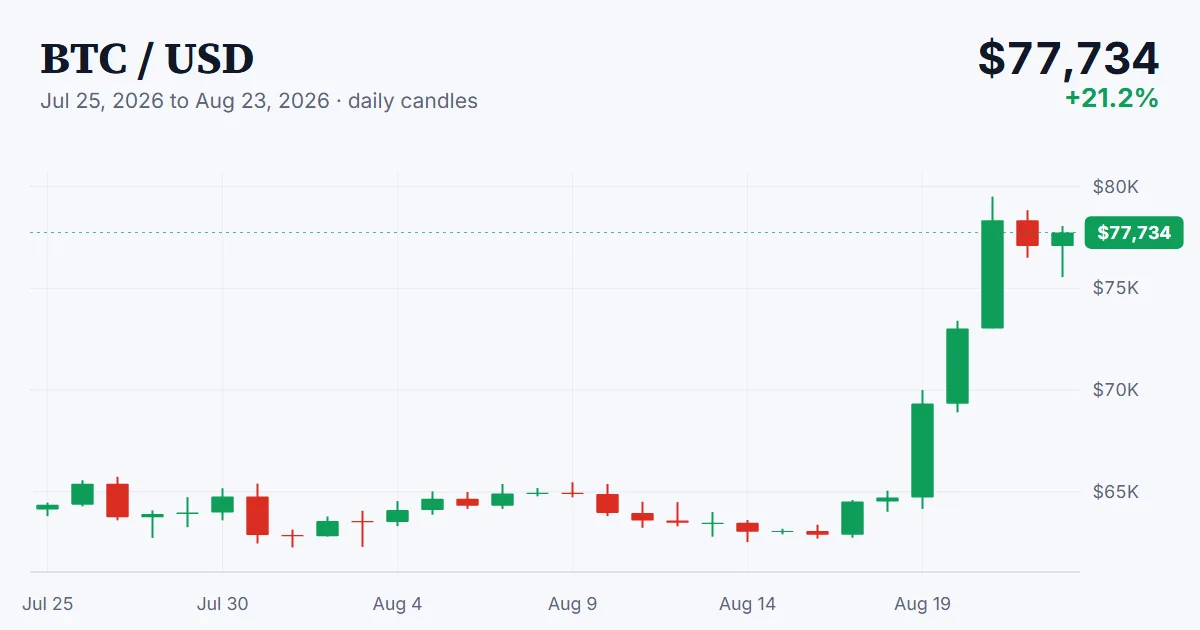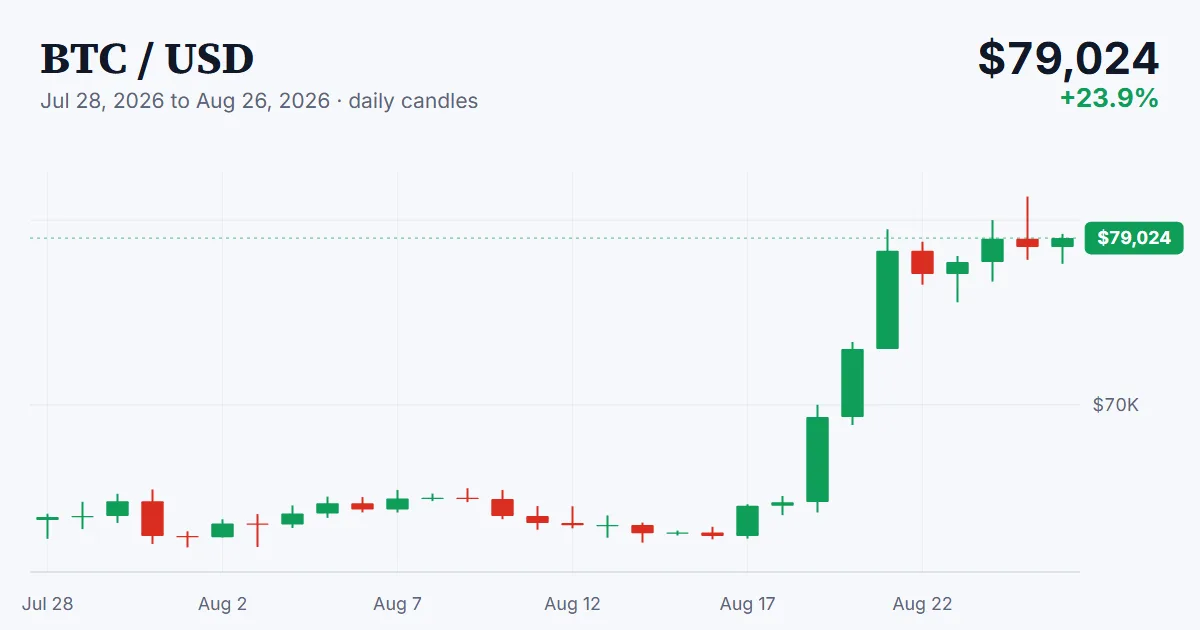
Every breakout eventually meets a seller with a reason, and Tuesday's had a name: the 50-week moving average. Bitcoin stretched to an intraday high of $81,265 on August 25, per CoinDesk's live coverage, and the rejection came almost exactly where that long-horizon trend line sat, around $81,085. By Wednesday the price had eased back under $79,000, trading near $78,500 per Proactive Investors and Interactive Crypto, which leaves Tuesday's milestone intact but unconfirmed. The level broke on a wick; owning it is a different job, and the market now gets to attempt it on the same day the Fed's favorite inflation gauge prints.
A technical rejection with fundamentals still pulling the other way
What makes this pullback readable rather than worrying is that the two forces involved are pointed in opposite directions, and both are measurable. The selling is technical. The 50-week moving average is one of the few lines that long-cycle trend followers genuinely trade around, and bitcoin had not been above it since the spring decline. A first touch after a 22 percent week practically invites profit taking, and Brisk Markets' read of the tape frames Wednesday's dip the same way we do: positioning ahead of a data-heavy stretch, not a rush for the exits.
The buying, meanwhile, has not blinked. CoinDesk counted a seventh consecutive day of net inflows into US spot bitcoin ETFs on Tuesday, and Interactive Crypto puts the running total above $2.2 billion since August 17, enough to make August the strongest month of the year for bitcoin ETF demand. Ethereum funds pulled in roughly $697 million in the week ended August 21 on top of that. This is the same demand engine we tracked through the $2.61 billion week, still running while the price consolidates, and it is the main reason the dip has so far stopped in the high $78,000s rather than somewhere uglier. When spot funds absorb supply through a rejection, the rejection tends to age into a retest rather than a top, though nobody gets that promise in writing.
PCE today, and the listing machine keeps humming underneath
The calendar is the other half of the setup. The July Personal Consumption Expenditures report lands today, August 26, the last hard inflation data before the Jackson Hole symposium opens Thursday and Kevin Warsh delivers his first keynote as Fed chair on Friday morning. The market has spent two weeks buying the idea of a friendlier Fed, helped along by the Treasury doubling its long-dated bond buybacks on August 19 and by the improving legislative mood in Washington, and it now gets the inflation number and the speech in the same week. A cool PCE print validates all of it and hands the bulls their retest of $81,000 with momentum behind it. A hot one forces the question the chart just asked: whether this rally is a trend change or a very well-funded bounce inside a drawdown. We do not pretend to know which number prints, and we would distrust anyone who claims to.
Down the tape, the risk appetite is spilling into the listing pipeline, which is usually a late-cycle tell worth watching for its own sake. Coinbase followed Friday's four-token roadmap batch with an actual listing announcement on Tuesday: spot pairs for Basecat and DebtReliefBot, two Base memecoins, will go live once liquidity conditions are met, with Dolphin and Grass still waiting on their own confirmations. We opened tracker pages for BASECAT and DRB with the honest status, announced rather than listed, and the GRASS page keeps its rumored tag until Coinbase names its pairs. When a major US venue starts clearing memecoins through its pipeline during a rally, it says something about where the exchange thinks retail attention is heading. Whether that enthusiasm survives today's inflation number is this week's actual story, and by Friday the chart will have answered a question the commentary cannot.