All week we kept writing some version of the same caveat: the squeeze is loud, the spot bid is the part that matters, watch the flows. The receipt arrived Saturday. US spot bitcoin and ether ETFs absorbed a combined $2.61 billion in the five sessions ended August 21, their strongest week since October 2025, per SoSoValue data reported by The Block and crypto.news. Bitcoin funds took $1.92 billion of it and ether funds $697 million, every single session closed green, and weekly trading volume across both products more than tripled to about $29 billion. One week earlier, these same desks were bleeding $392 million. The swing between the two weeks is roughly $3 billion, which is about as sharp a reversal as this market structure produces.
The shape of the week tells you what drove it. The first two sessions were solid but unremarkable, then the Treasury buyback announcement and the White House push for the Clarity Act landed midweek, and the flows went vertical: a combined $706 million on Wednesday August 19, then $827 million on Thursday August 20, the strongest day of the run, before a still healthy $492 million Friday. Thursday's bitcoin total of $606.3 million was the largest single bitcoin day since early May, and BlackRock's IBIT accounted for $503 million of it on its own, per The Block.
One issuer is doing most of the lifting
Concentration is the detail we would flag before anyone gets carried away with the headline number. On Friday, IBIT took $239 million of the $307 million that flowed into bitcoin funds, about 78 percent, and BlackRock's ether fund ETHA absorbed $151 million of the $185 million ether total, roughly 82 percent, per crypto.news. That is not a broad institutional stampede across a dozen issuers; it is primarily one asset manager's distribution machine turning back on. It worked in both directions all year, IBIT led the outflow weeks too, so the honest reading is that these flows are a fast channel, not a diversified one.
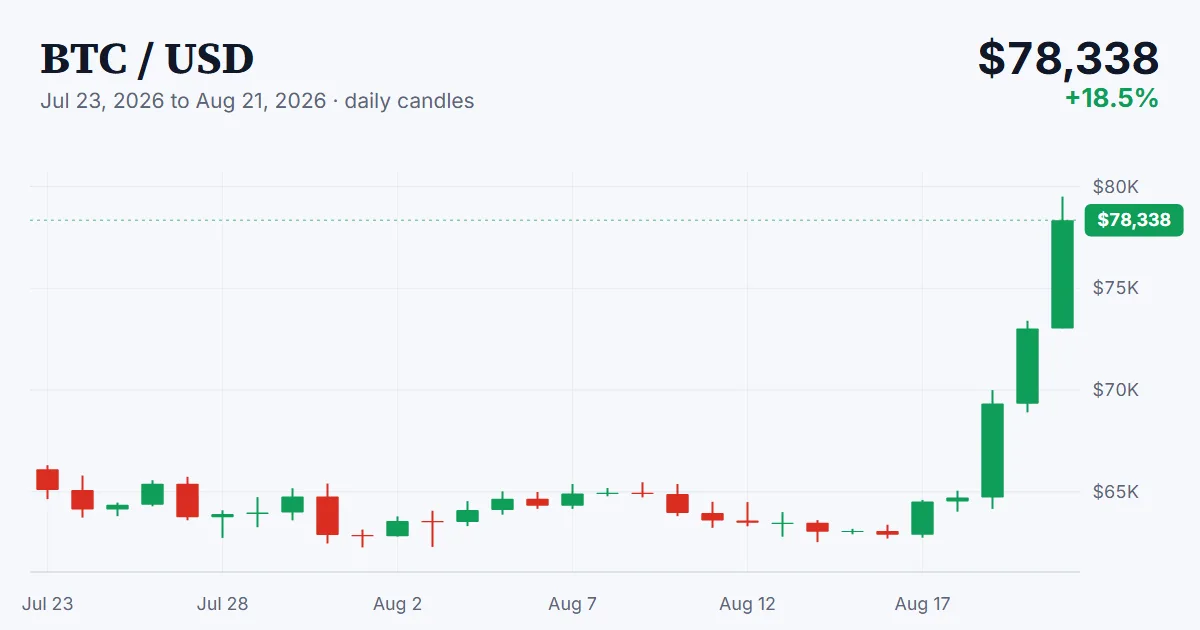
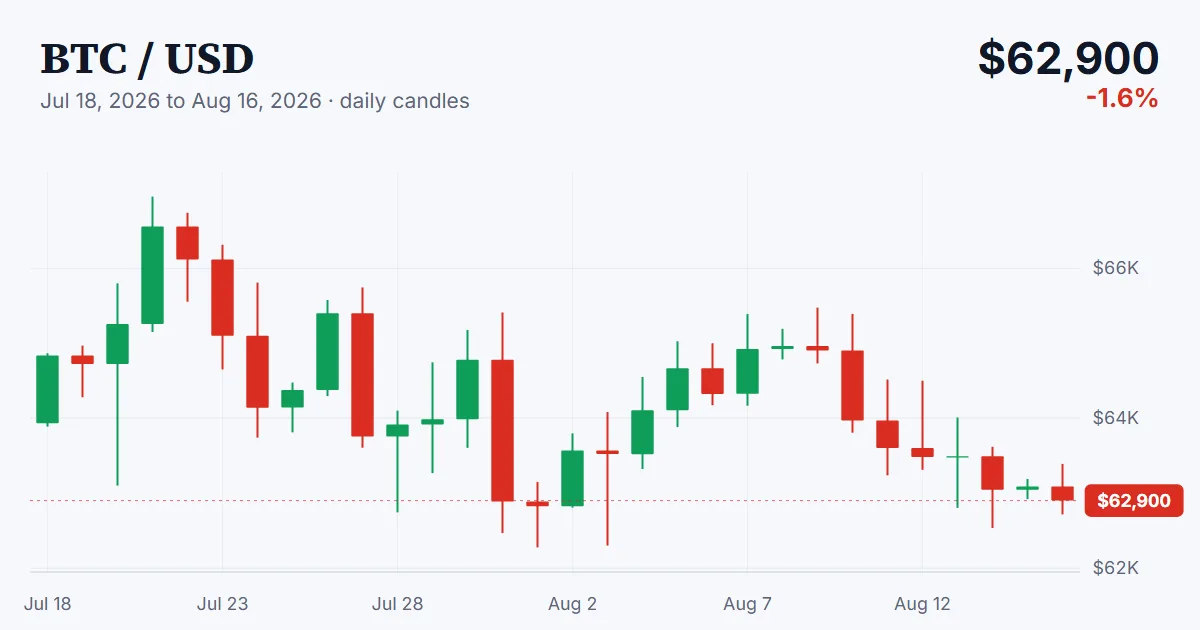
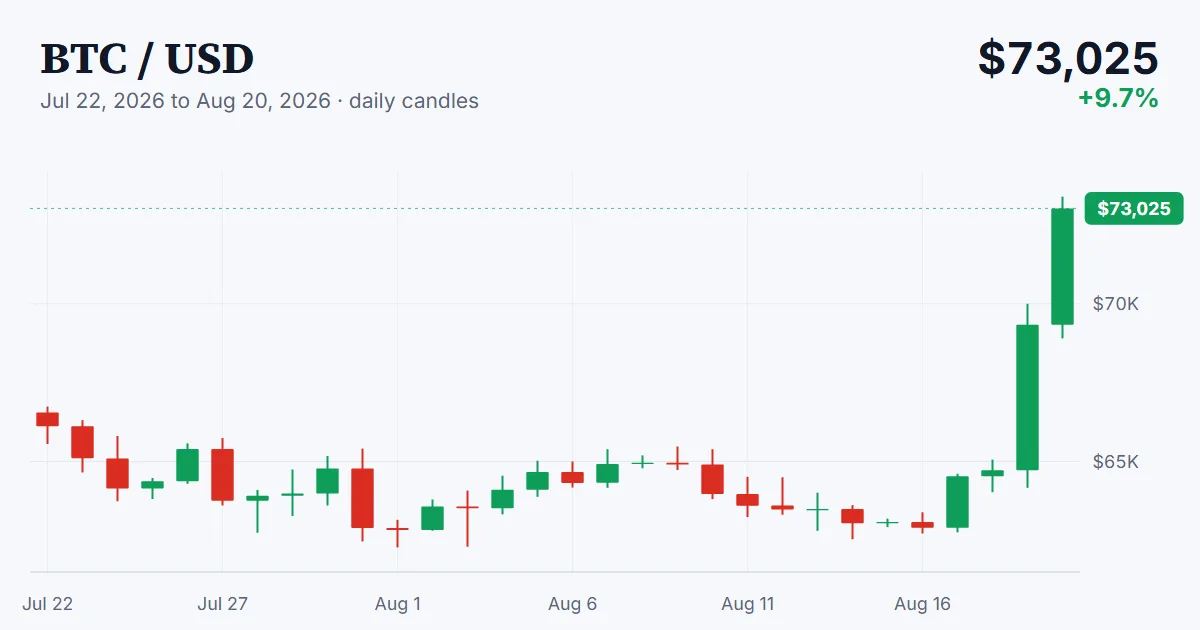
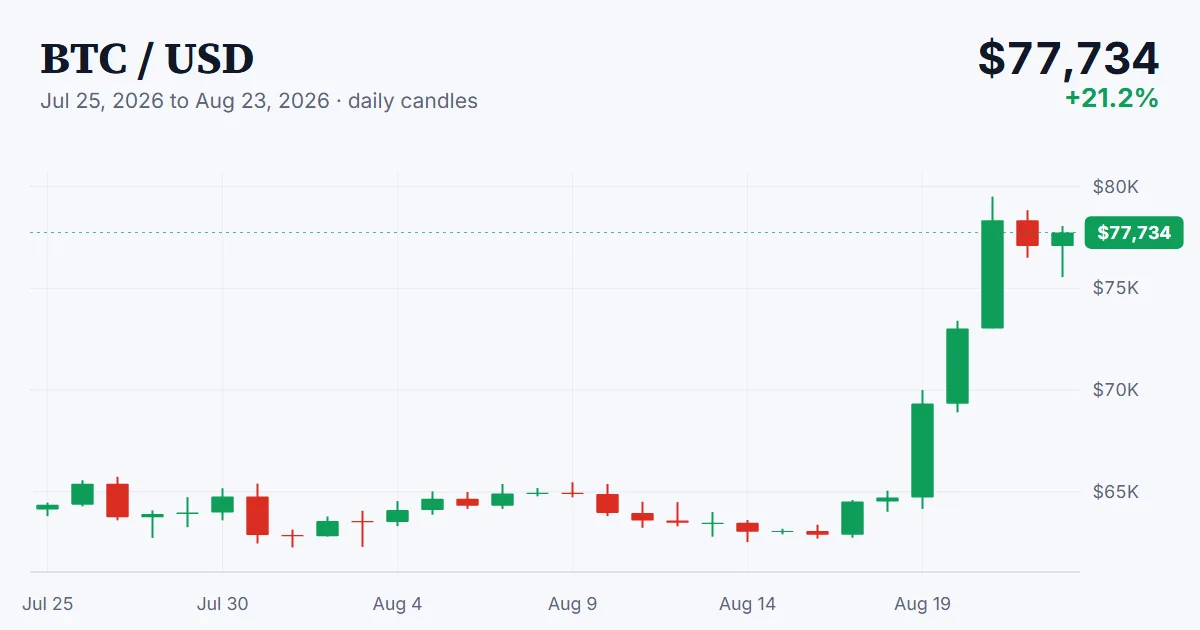
The volume side of the ledger is arguably the more impressive statistic. Bitcoin ETF volume hit $22.1 billion for the week, up 219 percent from $6.9 billion the week before, while ether ETF volume rose about 259 percent to $6.9 billion, per The Block. Assets under management moved accordingly: bitcoin ETFs closed the week at $96.1 billion and ether ETFs at $14.3 billion, which per crypto.news works out to about 6.2 percent of bitcoin's entire market value and 4.9 percent of ether's sitting inside US wrappers. Prices did their part, with bitcoin briefly trading above $79,000 on Friday before settling near $77,200 Saturday and ether holding around $2,423, per The Block. For how the week started, our range-break coverage has the trigger sequence.
The year is still red, and that is the tell
Zoom out one notch and the picture gets more sober. Even after the best week in ten months, bitcoin ETFs remain approximately $2.9 billion in net outflows for 2026 and ether ETFs about $192 million underwater, per The Block. The combined year-to-date deficit compressed from $5.7 billion to $3.1 billion in a single week, a number that flatters the week and indicts the year at the same time. LVRG Research's Nick Ruck put the skeptical case plainly, arguing the inflows will likely prove "temporary rather than structural" without further confirmation, per crypto.news. That rhymes with the squeeze math we walked through on Thursday: forced short covering front-loaded the price move, and the ETF bid arrived after the fireworks started, not before.
What would confirmation look like? The same thing it always looks like: boring persistence. October's record stretch was followed by months of net selling, so one strong week proves capacity, not commitment. The calendar offers three tests in short order, Jackson Hole from August 27 to 29, the expanded Treasury buyback operations beginning September 9, and the Clarity Act cloture attempt in mid September. If the daily prints stay positive through an event that disappoints, that is structural demand showing itself. If the first red macro headline flips the flows negative again, we are back in the regime that produced the $5.7 billion hole. We will keep the weekly tally honest either way, because the flows, not the price, are the cleanest signal this market gives away for free.